

The Agilien interface is divided into three main columns, each serving a specific purpose in your workflow.
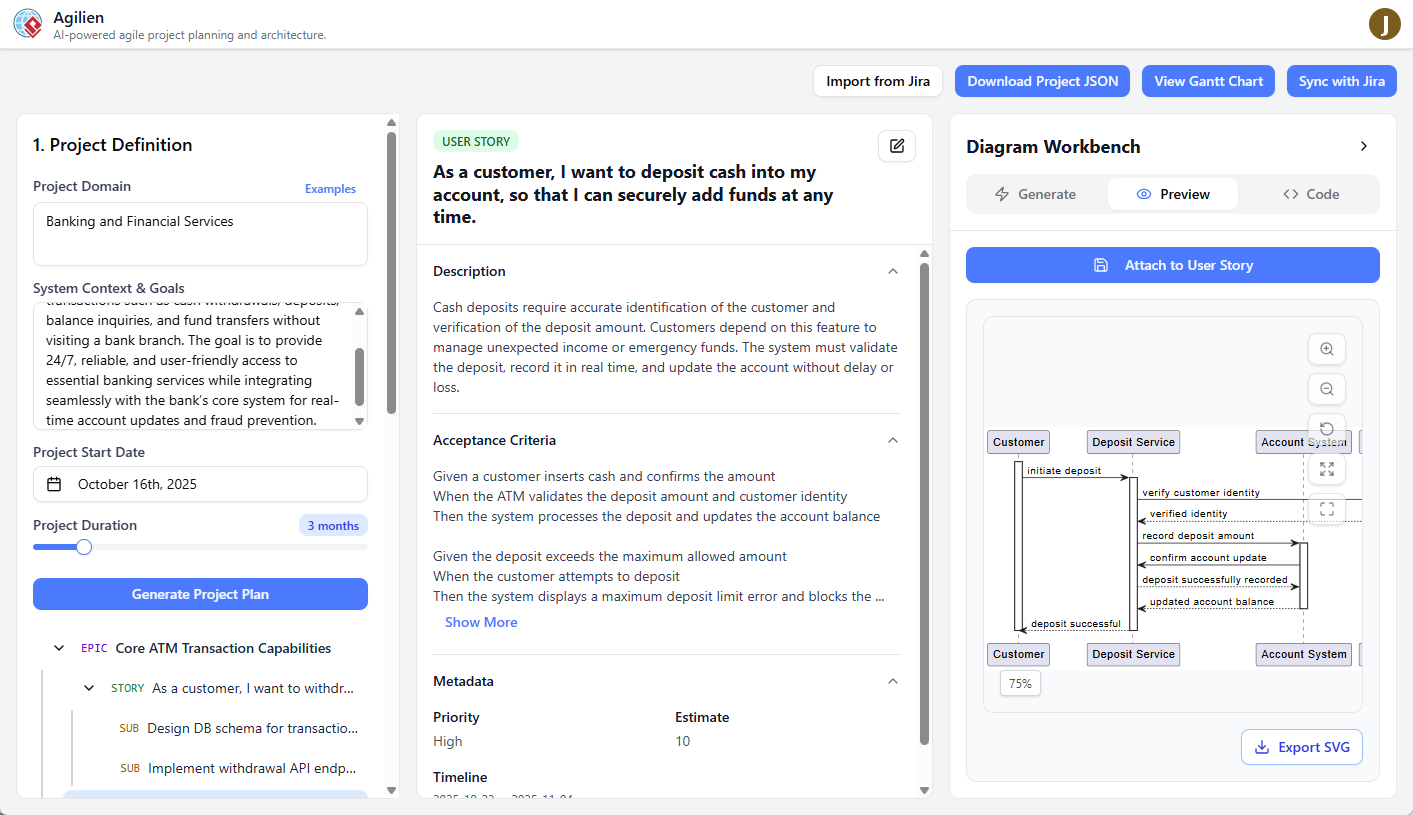
1. The Left Panel: Project & Hierarchy
This panel is your starting point and primary navigation hub.
- Project Definition: The form at the top where you describe your project to the AI. This includes the domain, context, start date, and duration. You can also access the Example Gallery from here.
- Project Hierarchy: Once a project is generated, this tree view displays the entire structure of Epics, User Stories, and Sub-Tasks. Clicking an item in this tree selects it and populates the other panels with its data.
2. The Middle Panel: Item Details
This is where you view and edit the details of the currently selected item from the hierarchy.
- Header: Shows the item’s type (Epic, Story, Sub-Task), its title, and its Jira Key (if synced). The Edit button is also located here.
- Description: The main body of the work item. For User Stories, this describes the user’s perspective and goal.
- Acceptance Criteria: For User Stories, this section outlines the “Given-When-Then” conditions that must be met for the story to be considered complete.
- Metadata: A quick overview of the item’s priority, estimate, and scheduled start and end dates.
- Diagram Attachments: If you’ve created and saved any diagrams for this item, they will appear as thumbnails here. Clicking a thumbnail loads it into the Diagram Workbench for viewing or further editing.
3. The Right Panel: Diagram Workbench
This powerful tool allows you to visualize any work item as a formal diagram.
- Diagram Type Selector: Choose the type of diagram you want to generate (Sequence, Activity, or Class).
- Generate Diagram Button: After selecting an item and a diagram type, click this button to have the AI generate the diagram code and a visual preview.
- Attach/Update Button: Once a diagram is generated, this button allows you to save it as an attachment to the selected work item. If you’ve loaded an existing diagram, this button will say “Update Diagram.”
- PlantUML Code Editor: A collapsible section that reveals the raw PlantUML source code for the generated diagram. You can directly edit this code, and the visual preview will update in real-time. This is perfect for fine-tuning the AI’s output.
- Preview Area: Displays the rendered SVG of the diagram.