

Beyond the core workflow, Agilien offers several features for project management and customization.
View Gantt Chart
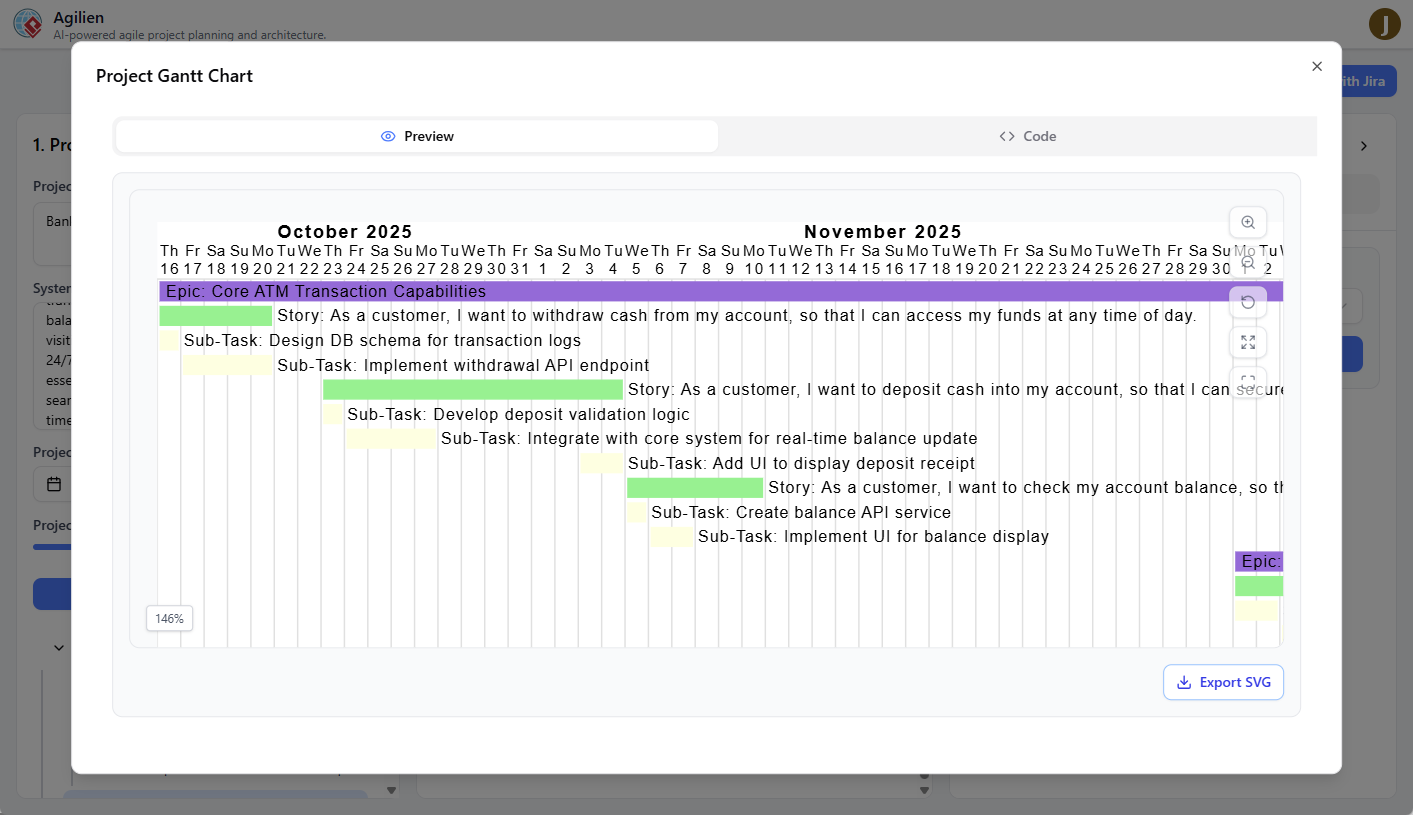
A Gantt chart provides a high-level timeline view of your entire project, showing the duration and scheduling of all epics, stories, and sub-tasks.
- Ensure you have a project generated.
- Click the View Gantt Chart button in the top header.
- A modal will appear, generating the chart. This may take a few moments.
The Gantt chart modal provides several tools:
- Visual Chart: An SVG rendering of the timeline. You can scroll to see the entire project.
- Download SVG: Save a copy of the Gantt chart as an SVG file for use in presentations or other documents.
- Copy PlantUML: Copies the raw PlantUML code for the chart to your clipboard, allowing you to use it in other tools that support PlantUML.
- Code Viewer: A read-only view of the PlantUML code is also available at the bottom of the modal.
Download Project JSON
You can export the entire project plan as a local JSON file. This is useful for:
- Backing up your work.
- Sharing the plan with others.
- Using the structured data in other scripts or tools.
To download the project, simply click the Download Project JSON button in the header.